|
September 30, 2006
A silly graph on a serious matter
In a post at the Volokh Conspiracy, David Bernstein links to a graph produced originally by Liz Ann Sonders, the Chief Investment Strategist at Schwab. The graph strikingly shows the relationship between the NAHB housing index and the S&P 500 index, with the clear implication being that equities are due for a big fall. It's certainly striking, but it's also very silly. It's common practice in the investment strategy field to produce graphs of this kind: superimpose two lines, shift one by a few months, and you have an immediate prediction mechanism for something or other. The problem is, these graph are seldom based on true insight, and even less often on rigorous quantitive analysis. I've seen quite a few of these peddled over the years, including some more far-fetched that this one. The guilty shall remain nameless. Aside from the natural curiosity of what happens to the relationship on a longer timescale than the one shown, the graph cannot make fundamental sense, at least not in the way it is implying it can. The main problem is that the two lines represent totally different kinds of indices: the S&P has no maximum possible value, while the NAHB is a diffusion index that by defition will have a value between 0 and 100. If we take the graph at face value, it would imply that the S&P would have a maximum value of around 2,000, a 50% or so increase from current levels. That's clearly nonsensical. Looking at the history of the relationship, you can see how this breaks down: 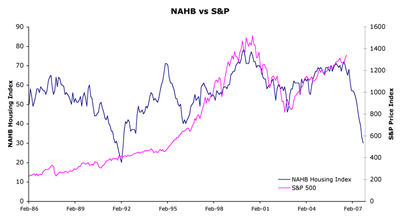 Prior to 1995, there is no relationship whatsoever between the two. But the really weird thing is that it does work very well in the period since then. Doing a regression of the NAHB against the S&P 500, you end up with an R-squared of 0.77: 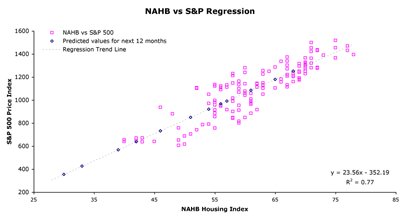 That's a pretty powerful explanatory relationship. Taking it at face value, it would mean that with the NAHB housing index at 30, the S&P 500 would have to fall to 354, a drop of 74% from current levels, or 10.5% a month, every month for the next year. Using the S&P 500 total return index, which includes dividends, the R-squared is even higher at 0.80, and implies a drop of 81% in the S&P in a year, or 13.0% per month. That's some pretty serious declines there. And they're not going to happen. At least, not in that magnitude. I think it's perfectly reasonable to predict some declines in the S&P, but relying too much on this graph and its implied message of doom is not the way to do it. As Lev, one of the commenters at the Volokh Consipracy pointed out, Schwab agrees with this as well, as they're underweighting equities by only 5%. That's hardly a message of doom. However, it is clear that the US housing market is in trouble. That can certainly be inferred from the NAHB index. I agree that the US residential housing market has experienced a bubble, and that it is deflating, but I'm not inclined to conclude that the US economy is bound to collapse as a result. The risk does exist, but it's not a foregone conclusion. So while using the NAHB index to predict the S&P is not going to lead to much joy, it might lead to insight into the development of house prices. Mapping the NAHB index against real median house prices (deflated with headline CPI), the relationship is still pretty weak: 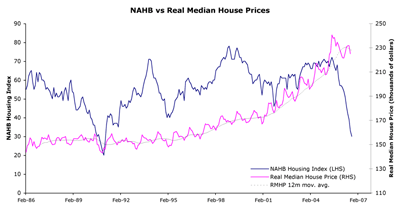 Real house prices stayed flat throughout the 1980s, and only began to rise in the 1990s and seem to have peaked in the recent past. The NAHB index has been useful in picking up some of the downdrafts, but not in a truly convincing fashion. Further declines will take place given the bubble that has developed, but I remain skeptical that it is going to derail the economy in a significant way. While there will be people who get burned badly on their speculative purchases, it takes a truly big downturn to turn this into a broad economic recession. Evidence from other countries with housing bubbles, like the Netherlands, UK and Australia shows that markets can go through step-changes in pricing without suffering crashes later. (Of course, we're not out of the woods on any of those yet, and they could yet sell off in the coming years if interest rates rise dramatically). Higher rates and slower growth led to a moderation of house prices and some falls overall, but not a crash. Median house price to median income ratios in these three countries are all higher than the US at around 3.5. (Sorry, I don't have a source at hand, so I'm typing this from memory). The reason why people do worry that the US experience will be more painful is that US mortgage equity withdrawal has been a big factor in driving consumer spending. Should house prices fall, mortgaged home owners could end up with negative equity and become forced sellers. Less dramatically home owners might simply stop withdrawing home equity, and thereby be forced to cut down on spending. So how extended is the US homeowner? The Federal Reserve has an amazing amount of data in its Flow of Funds data, and sometimes they calculate data for us. In the below graphs I have taken the data from the FoF unless otherwise noted. Can consumers still pay for their mortgages with higher interest rates? The amount they need to spend on servicing their debt has been rising, although the mix has been shifting towards mortgage debt: 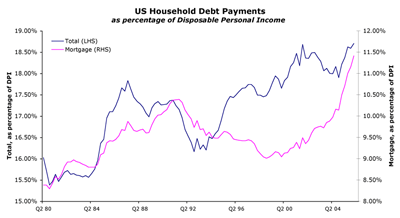 With both total and mortgage debt servicing costs at historic highs, it is clear that consumers will be hard-pressed to take on more debt. I have no idea what a natural and reasonable upper limit would be though. It could go even higher, but I would tentatively assume that any further increases will be limited. A similar picture results when plotting mortgage liabilities relative to total net wealth and relative to real estate assets: 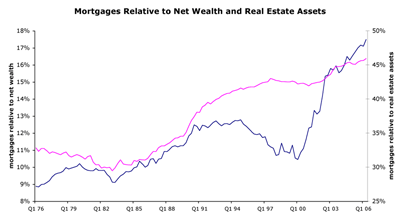 In both cases the US consumer now has reached record levels indebtedness relative to assets. With mortgage liabilities equalling about 17% of total net wealth, and about 48% of real estate assets, both measure seem to indicate that while the situation mamy be stretched historically, there is still a big buffer to eat into should things go wrong. Total real estate wealth would have to be cut in half for the market as a whole to experience negative equity. So far, so good. But these numbers only show the aggregates. They do not show the details one would need to do a proper analysis of the situation. It'd be much more interesting to see the distribution of mortgages versus real estate assets: what percentage of households is overmortgaged? How many households have no mortgage at all? What's happening in the tails of the distribution? Unfortunately, I don't have that data. So all I can do is ruminate vapidly on the basis of the data I do have, and the best I can do there is the following. The US housing is deflating a bubble, but the pain this will cause will not be widely distributed across the economy. As long as people have jobs, they will still be able to pay their mortgages. The problem arises when they become forced sellers (for instance, when they lose their jobs). Rather than causing a recession, it would be the recession with its layoffs that will cause the housing market really to sell off. It's a definite risk but not something I expect to happen. I won't go into the details here as it would require another lengthy post. There is one glaring omission in all of the above: what about home equity withdrawal? For something that's been so instrumental in sustaining economic growth, reliable numbers are suprisingly hard to find. I've seen wildly contradictory numbers on this, ranging from a pickup to historic highs this year to a massive fall-off. I have tried to reproduce the numbers myself from the FoF and national accounts (and other sources), but without any success. The great cathartic collapse of the bubble in real estate is unlikely to happen. It will continue to deflate, and will cause problems locally, but unless the US economy ends up in a recession, there is no reason to become despondently gloomy. Comments
Post a comment
|
